華信光電將參加日本國際雷射加工技術展 Photonix 2016, 歡迎您的來訪!!
聚焦地科
聚焦地科2024-01-29
黃彥婷老師「都會區空氣污染對熱帶太平洋與全球氣候的影響」
東部赤道太平洋是聖嬰現象的發源地,對於調控全球均溫及影響世界各地極端天氣事件扮演關鍵角色。因此,準確預測這一地區的海水溫度對氣候學家來說是一項重要任務。在全球暖化趨勢日益明顯的背景下,該地區過去40年卻出現了海表溫度降低的現象,這一異常趨勢的原因一直是科學界探討的焦點。先前研究指出,發電廠和工業區的氣溶膠排放不僅對人類健康有害,還會反射太陽光造成降溫。然而,隨著全球範圍內空氣污染法規的加強,氣溶膠排放自1980年代以來已顯著減少,但東太平洋的海水溫度持續下降,原因不明。
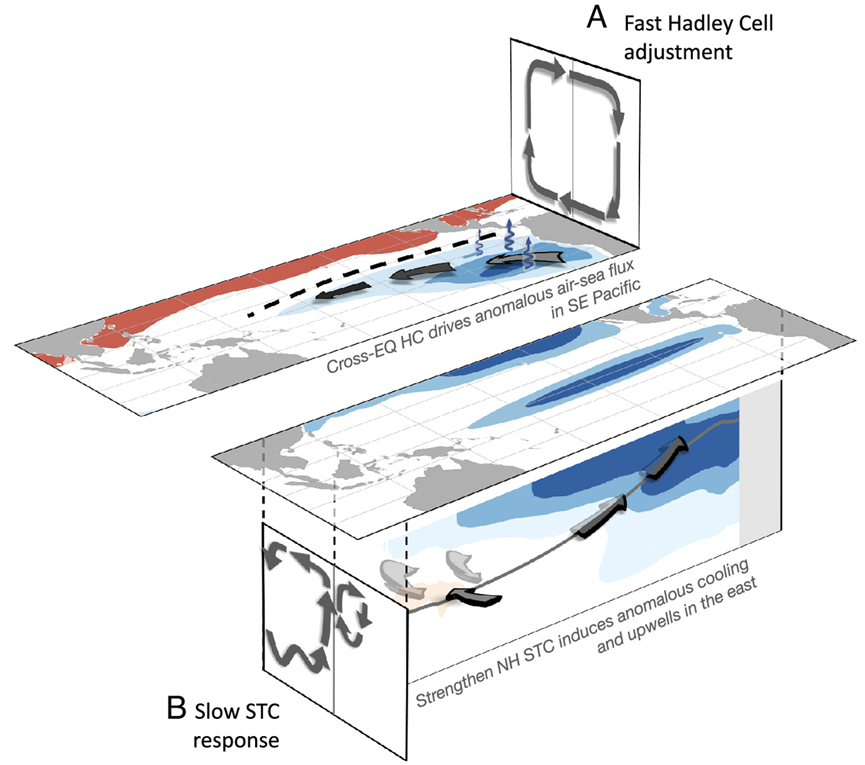
台灣大學理學院大氣系黃彥婷副教授主導的跨國研究團隊在《美國國家科學院院刊》(PNAS) 2024年1月的最新發表研究成果中指出,氣膠對赤道太平洋海水溫度的影響可能在近年達到高峰,且這一高峰出現在氣膠減排之後的數十年。這一結果可能令人驚訝,因為氣膠在大氣中的壽命很短(大約兩週,遇到下雨則更短),但其所產生的氣候效應卻在減排後的數十年才顯現。這種特殊的延遲反應可以透過氣候系統對氣膠輻射冷卻的快速和慢速兩種時間尺度反應來解釋(如圖一所示):大氣環流在氣膠減排後迅速調整,改變熱帶信風強度,進而導致東南及中赤道太平洋的冷卻。同時,自工業革命以來氣膠排放冷卻效應進入海洋,緩慢的增強海洋經向翻轉流,進而冷卻赤道次表層海水。這兩因素疊加,使得氣膠對東赤道太平洋表層及次表層的冷卻效果在2020至2030年之間達到高峰。
從理論上來說,這項研究為理解熱帶太平洋的氣候變化提供了新的視角,將研究重心從單一洋盆波動動力學轉移到了由能量變化驅動的跨半球和跨洋盆的遙相關機制。從實用性的角度來看,此研究為評估和修正全球氣候模型預測提供了框架,並暗示氣溶膠作為減緩全球暖化的保護傘可能將加速消失。研究團隊感謝大氣系的同事以及國科會年輕學者養成計畫,長期穩定的支持讓他們得以透過逐漸增加模式複雜度的方式,一步步擴展理論理解,並將這些理論與真實世界的情境相連結。
論文連結:https://www.pnas.org/doi/full/10.1073/pnas.2315124121
黃彥婷副教授 氣候動力與全球變遷研究室連結:https://sites.google.com/view/climatentu/

Figure 6. A schematic illustrating the distinct characteristics of and the interplay between the fast component of aerosol emission reduction and the slow component of aerosol emission increase. Shadings represent anomalous oceanic potential temperature. Arrows in the two vertical planes are the anomalous cross-equatorial Hadley Cell and the anomalous oceanic STC. The thick arrows in the Top panel A illustrates intensified trades and the thin blue arrows illustrate the associated air-sea fluxes. The thick arrows in the Bottom panel B illustrate how the intensified STC induces cold water, which converges in west Pacific subtropics and upwells in the east.
本文轉載自國立臺灣大學大氣科學系首頁,連結如下:
https://www.as.ntu.edu.tw/index.php/component/k2/item/1125-%E9%BB%83%E5%BD%A5%E5%A9%B7%E8%80%81%E5%B8%AB%E3%80%8C%E9%83%BD%E6%9C%83%E5%8D%80%E7%A9%BA%E6%B0%A3%E6%B1%A1%E6%9F%93%E5%B0%8D%E7%86%B1%E5%B8%B6%E5%A4%AA%E5%B9%B3%E6%B4%8B%E8%88%87%E5%85%A8%E7%90%83%E6%B0%A3%E5%80%99%E7%9A%84%E5%BD%B1%E9%9F%BF%E3%80%8D
台灣大學理學院大氣系黃彥婷副教授主導的跨國研究團隊在《美國國家科學院院刊》(PNAS) 2024年1月的最新發表研究成果中指出,氣膠對赤道太平洋海水溫度的影響可能在近年達到高峰,且這一高峰出現在氣膠減排之後的數十年。這一結果可能令人驚訝,因為氣膠在大氣中的壽命很短(大約兩週,遇到下雨則更短),但其所產生的氣候效應卻在減排後的數十年才顯現。這種特殊的延遲反應可以透過氣候系統對氣膠輻射冷卻的快速和慢速兩種時間尺度反應來解釋(如圖一所示):大氣環流在氣膠減排後迅速調整,改變熱帶信風強度,進而導致東南及中赤道太平洋的冷卻。同時,自工業革命以來氣膠排放冷卻效應進入海洋,緩慢的增強海洋經向翻轉流,進而冷卻赤道次表層海水。這兩因素疊加,使得氣膠對東赤道太平洋表層及次表層的冷卻效果在2020至2030年之間達到高峰。
從理論上來說,這項研究為理解熱帶太平洋的氣候變化提供了新的視角,將研究重心從單一洋盆波動動力學轉移到了由能量變化驅動的跨半球和跨洋盆的遙相關機制。從實用性的角度來看,此研究為評估和修正全球氣候模型預測提供了框架,並暗示氣溶膠作為減緩全球暖化的保護傘可能將加速消失。研究團隊感謝大氣系的同事以及國科會年輕學者養成計畫,長期穩定的支持讓他們得以透過逐漸增加模式複雜度的方式,一步步擴展理論理解,並將這些理論與真實世界的情境相連結。
論文連結:https://www.pnas.org/doi/full/10.1073/pnas.2315124121
黃彥婷副教授 氣候動力與全球變遷研究室連結:https://sites.google.com/view/climatentu/

Figure 6. A schematic illustrating the distinct characteristics of and the interplay between the fast component of aerosol emission reduction and the slow component of aerosol emission increase. Shadings represent anomalous oceanic potential temperature. Arrows in the two vertical planes are the anomalous cross-equatorial Hadley Cell and the anomalous oceanic STC. The thick arrows in the Top panel A illustrates intensified trades and the thin blue arrows illustrate the associated air-sea fluxes. The thick arrows in the Bottom panel B illustrate how the intensified STC induces cold water, which converges in west Pacific subtropics and upwells in the east.
本文轉載自國立臺灣大學大氣科學系首頁,連結如下:
https://www.as.ntu.edu.tw/index.php/component/k2/item/1125-%E9%BB%83%E5%BD%A5%E5%A9%B7%E8%80%81%E5%B8%AB%E3%80%8C%E9%83%BD%E6%9C%83%E5%8D%80%E7%A9%BA%E6%B0%A3%E6%B1%A1%E6%9F%93%E5%B0%8D%E7%86%B1%E5%B8%B6%E5%A4%AA%E5%B9%B3%E6%B4%8B%E8%88%87%E5%85%A8%E7%90%83%E6%B0%A3%E5%80%99%E7%9A%84%E5%BD%B1%E9%9F%BF%E3%80%8D